Home Page
The Home Page provides an interactive map-based overview of all devices in an organization’s deployment.
It is designed to give users an immediate understanding of where their devices are located,
how many are active, and what their most recent status is.
The map serves as the primary visualization tool for daily monitoring.
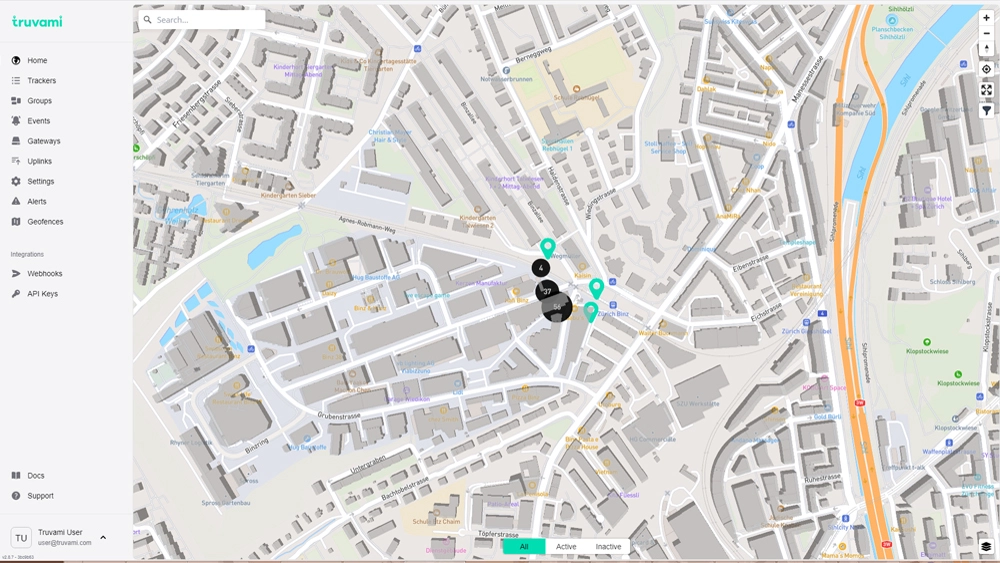
Map Interface
The central element of the Home Page is the interactive map, which displays devices as markers based on their last reported location.
Device Markers
Each device is shown as an individual marker. Selecting a marker reveals a popup with key information about the selected device.
Clustering
When multiple devices are located close to each other, they are automatically grouped into a cluster marker.
Clicking a cluster zooms in or expands it to reveal the individual devices inside.
Map Controls
Users can interact with the map using several standard controls:
- zoom in / zoom out
- reset map view
- center on the user’s current location
- toggle map layers (if available)
The map supports panning and zooming via mouse or touch gestures.
Search Bar (Address Search Only)
Located in the upper-left corner, the search bar allows users to search for addresses.
When an address is selected, the map automatically focuses on that location.
This search bar does not support searching for devices, IDs, groups, or any other dashboard entity.
It is strictly used for address lookup.
Device Popup
Clicking a device marker opens an information popup with essential details about the device’s latest known state.
The popup typically includes:
- Device name
- DevEUI
- Last update timestamp
- Resolved address
- Location accuracy (e.g., ≤ 10 m, Good)
- Device type (e.g., Tag S)
A View Details button leads to the full device page, where historical data, sensor values, uplink messages, and
other device information can be reviewed.
Device Filters
At the bottom of the map, users can filter visible devices based on their activity state:
All
Displays every device in the organization.
Active
Shows only devices that have recently reported data.
Inactive
Shows devices that have not reported data for a longer period.
These filters update the map visualization in real time.