Device Details
The Device Details page provides a complete overview of a specific tracker, including its identity, recent activity,
location history, uplinks, configuration, battery information, and linked alert rules.
This view is opened by clicking a device entry in the Trackers list.
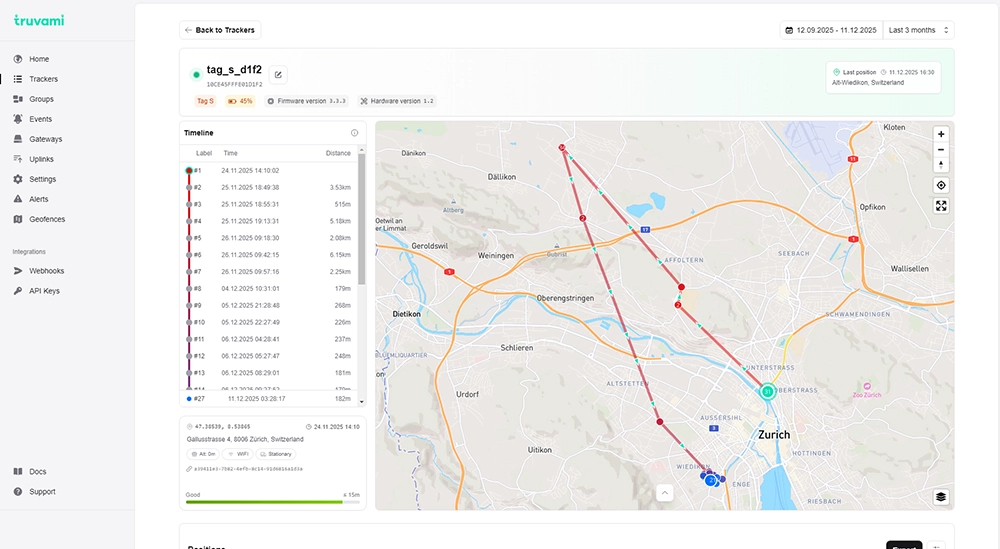
Header Section
At the top of the page, key information about the device is displayed:
- Device name
- DevEUI
- Device type (e.g., Tag S)
- Battery status (percentage, color-coded)
- Firmware version
- Hardware version
An edit icon next to the device name allows renaming the device.
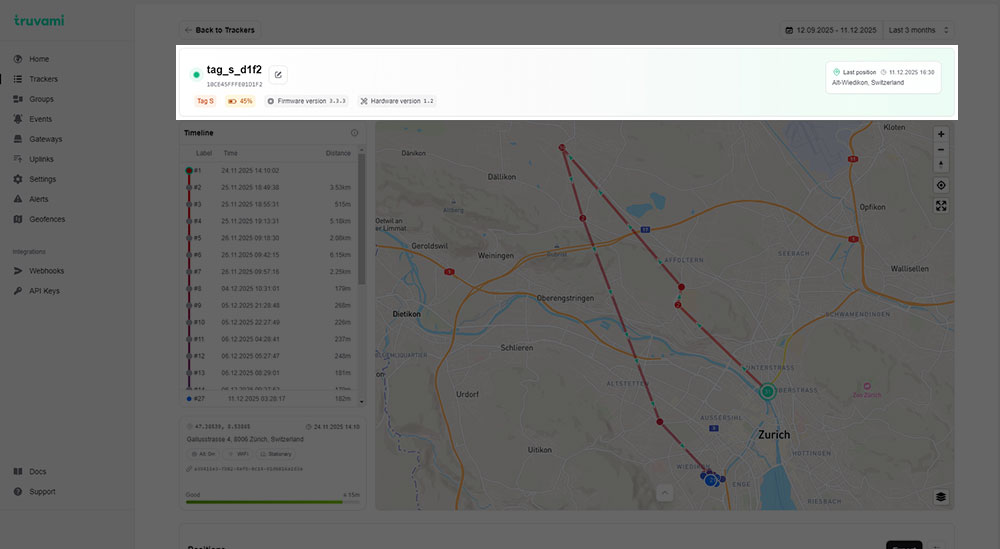
To the right, additional information is shown:
- Last known position (address, timestamp)
- Assigned group (if any)
A Back to Trackers button is available for navigation.
Date Range Selector
A date/time selector in the top-right corner allows filtering the displayed timeline and positions.
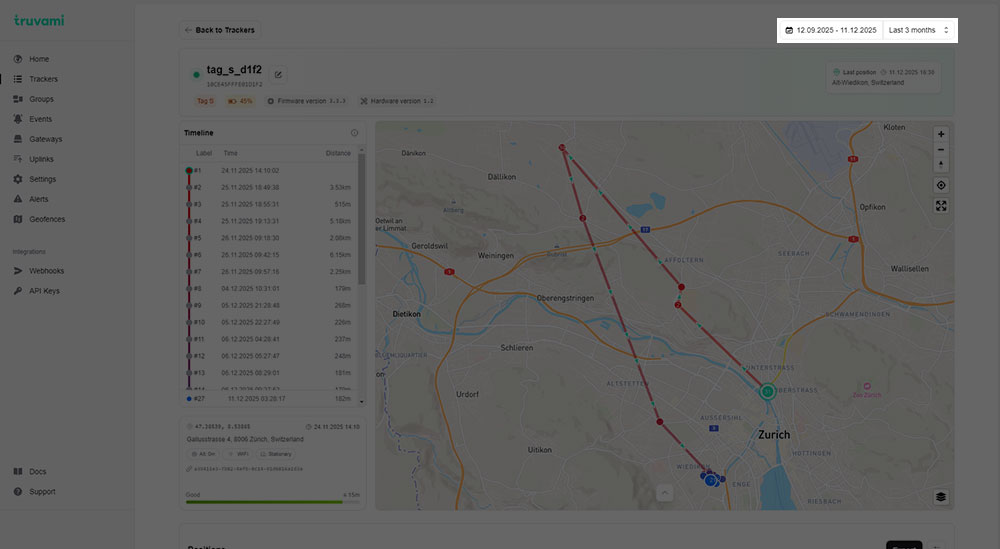
Users can select:
- custom start/end date
- predefined ranges (e.g., Today, Yesterday)
This filter updates both the timeline and the positions table.
Timeline
The Timeline section on the left provides a sequential list of location fixes for the selected time range.
Each entry includes:
- Label number (#1, #2, …)
- Timestamp
- Distance from the previous fix (e.g., 1m, 12m, 243m)
Selecting a timeline entry updates the map to focus on that specific location.
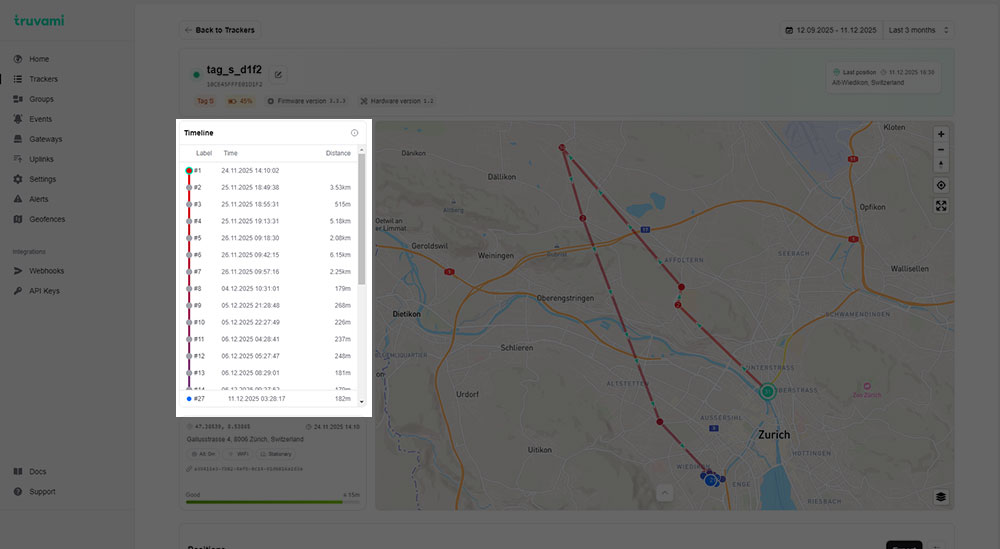
At the bottom, a small details card shows:
- Coordinates
- Address resolution status
- Fix source (Altitude, WiFi, GNSS, Stationary)
- Uplink
- Accuracy level (e.g., Medium / ≤ 50 m)
Map View
The right side of the upper page displays an interactive map with navigation tools and visual indicators for the selected device’s positions.
The map includes:
- Selected position marker
- Zoom controls
- Full-screen toggle
- Sequential navigation controls (play, next, previous)
- Current position index (e.g., “Position 4 / 5”)
- Position filtering button (opens the Position Filtering popup)
The map updates automatically when the user navigates through the timeline.
Position Filtering Popup
Clicking the filter icon in the bottom control bar opens the Position Filtering popup.
This dialog allows users to customize how positions are displayed on the map, helping reduce visual clutter or highlight specific movement patterns.
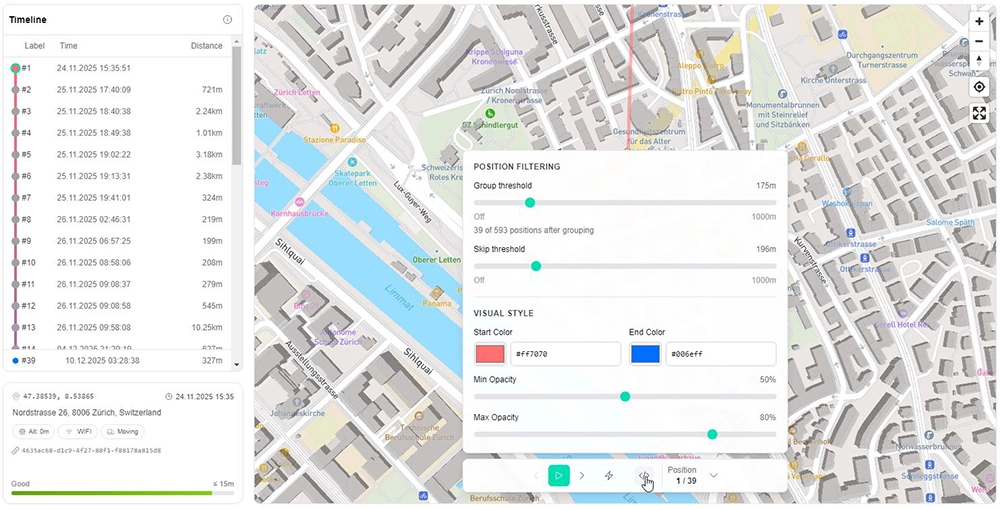
The popup contains two main sections:
1. Position Filtering
Group Threshold
A distance-based rule that groups nearby positions together.
- When enabled, positions within the selected threshold (e.g., 100m–1000m) are merged visually.
- This helps simplify dense position histories.
Options:
Off(default) — all positions are shown individually- Slider values up to 1000m
Skip Threshold
Filters out positions that are too close to the previous one.
- Useful for devices that report frequent stationary updates.
- Removes redundant fixes under a selected distance.
Options:
Off(default) — no positions are skipped- Slider values up to 1000m
2. Visual Style
Start Color / End Color
Defines a gradient applied to the path from oldest → newest position.
- Helps visualize chronology and movement progression.
- Users can pick any color via the color selectors.
Min Opacity / Max Opacity
Controls marker and path transparency.
- Lower opacity = more subtle visualization
- Higher opacity = more emphasis on positions
This is particularly useful for large datasets where overlapping paths occur.
How Filtering Affects the Map
Changes applied in the popup immediately update the map visualization:
- fewer or grouped markers
- simplified trajectory lines
- chronological gradient coloring
- improved clarity in dense urban clusters
Filtering does not alter timeline entries or the positions table — it only changes map visualization.
Positions Table
Below the map, the Positions section lists all location fixes recorded during the selected time interval.
Columns include:
- Timestamp – when the fix was generated
- Received At – when the fix was received by the backend
- Delay – time delta between generation and receipt
- Latitude / Longitude
- Altitude
- Moving – movement state (moving / steady)
- Source – WiFi, GNSS, LoRa, etc.
- Accuracy
- Buffered – whether the fix was buffered
- Buffer level – remaining buffer capacity
The table supports pagination and exporting through the Export button.
Events Section
The Events panel shows recent events associated with this device (filtered by the selected date range).
Each event shows:
- Event type (e.g., Duty Cycle)
- Timestamp
- Description
Scrolling is available when many events are present.
Current Configuration
This section displays the active configuration parameters for the device.
Typical configuration items include:
- Mode (Custom / Default / Profile-based)
- Moving interval
- Steady interval
- Battery keep-alive interval
- GPS timeout
- Motion delay
- Motion threshold
- Batch size
- Buffer size
A link allows opening the configuration editor (if available to the user).
Linked Alert Configurations
This section lists alert rules associated with this device.
If no alerts are configured, the text “No linked alerts found.” is shown.
Battery Section
A battery graph visualizes:
- Voltage over time
- Estimated battery percentage
The graph spans the selected date range and helps diagnose battery health trends.
Uplinks Section
The final section lists all uplinks sent by the device during the selected interval.
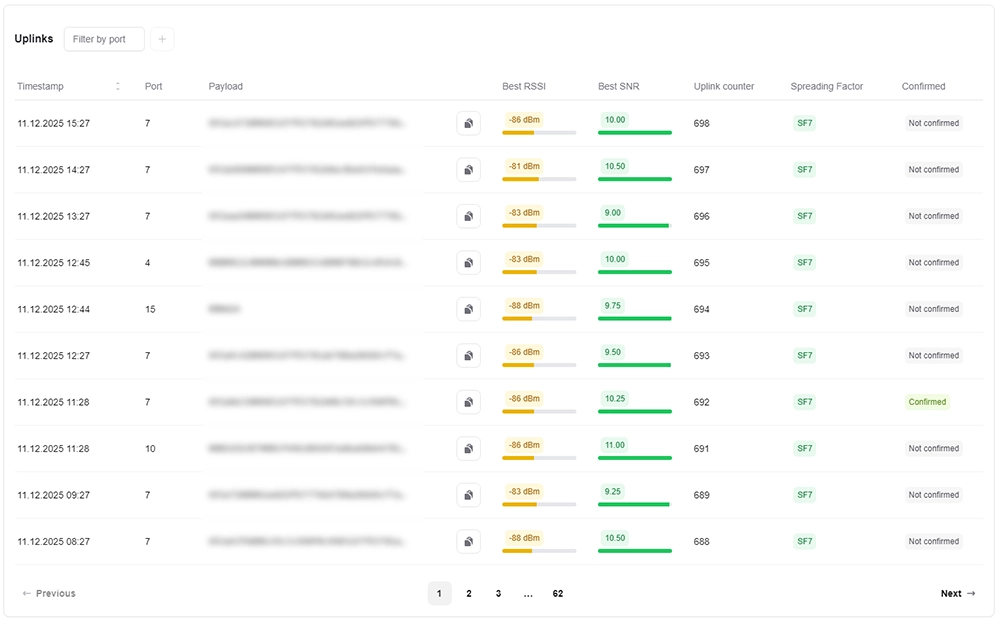
Columns include:
- Timestamp
- Port
- Payload
- Best RSSI / SNR
- Uplink counter
- Spreading factor
- Confirmed / Not confirmed
Clicking an uplink opens the full uplink detail page.
Pagination is available for navigating through long lists.